5 Metrics Flippers Use to Pick Neighborhoods and Avoid Execution Risk

The rule is simple: a neighborhood earns your capital only if it supports your target ARV and moves inventory fast. Pull days on market, comps, owner-occupancy ratio, and rehab density before you look at a single house. If days on market substantially exceed the typical range or comps are thin and irrelevant, stop. That neighborhood is not underwriting to a profit, no matter how the block looks on a Sunday drive.
TL;DR:
- Neighborhoods should have a days on market of 30 to 60 days for predictable sales, with supply under three months, indicating a seller’s market.
- Use conservative, expected, and optimistic comp tiers to set realistic ARV and price ceilings, adjusting for lot size, basement, and finishes.
- Confirm operational feasibility by assessing contractor lead times, permit durations, and local zoning, ensuring schedule and budget risks are manageable.
- Visually verify neighborhood health through drive-by inspections, checking for active renovations, new investment, maintenance, and avoiding negative proximity factors.
- Evaluate local economic and demographic trends, infrastructure plans, zoning, legal issues, and environmental hazards to determine long-term stability and profitability of flipping.
Table of Contents
- How Do You Evaluate a Neighborhood for Flipping?
- How Do You Set ARV and a Price Ceiling From Comps?
- What Operational Risks Change Whether a Neighborhood Works?
- What Should You See on a Drive-By That Confirms the Data?
- Building a Weighted Scorecard for Neighborhood Selection
- How to Field-Test a Neighborhood Before You Wire Earnest Money
- Assessing Neighborhood Economic Indicators
- Evaluating Local Zoning Laws and Future Development Plans
- Understanding Demographic Trends and Buyer Profiles
- Analyzing Neighborhood Infrastructure and Transportation Access
- Identifying Legal and Environmental Issues Before You Close
- Where FLIP Fits Into Your Neighborhood Screen
- Primary Sources and Data References
- FAQ
How Do You Evaluate a Neighborhood for Flipping?
Every neighborhood screen starts with five numbers. Pull them before you drive a single block.
- Days on market / absorption rate. Target 30 to 60 days on market. Inside that window, buyers are competing for inventory and your exit is predictable. Past 60 days, holding costs start eating margin you haven’t earned yet.
- Months of supply. Under three months of supply signals a seller’s market. Six months or more means your buyer has leverage, and your exit price will get negotiated down.
- Median sale price and price per square foot. These set your ceiling. If your rehab budget pushes the finished product above the neighborhood’s price per square foot ceiling, you built a house nobody in that zip code will pay for.
- Owner-occupancy ratio. Neighborhoods above 60% owner-occupied tend to have more retail buyers competing for your finished product, not just other investors flipping the same inventory.
- Rehab density and permit activity. A cluster of active permits on a street means capital is already flowing there. That’s a leading indicator, not a lagging one.
A market can look strong on appreciation charts and still fail on absorption. ATTOM’s Neighborhood Housing Index found that some of the highest gross flipping returns show up in lower-rated neighborhoods, not the top-tier ones. Ranking data alone doesn’t tell you if a neighborhood is flippable. The five metrics above do.
How Do You Set ARV and a Price Ceiling From Comps?
A comp is only valid if it matches on renovation status, bed and bath count, lot size, and school zone. A fully renovated 4-bed comp two school districts over tells you nothing about your unrenovated 3-bed.
Build three comp tiers before you touch a rehab budget:
- Conservative tier. The bottom third of qualified comps in the last 90 days. Use this number to set your MAO.
- Expected tier. The median of qualified comps. This is your working ARV for scope decisions.
- Optimistic tier. The top third. Use this only to sanity-check upside, never to underwrite.
Adjust each comp for lot size, basement finish, and kitchen or bath quality. One exceptional sale does not set the market ceiling. Underwrite to the conservative number and keep a second exit path, retail sale or rental, in case the market softens mid-project.
Pro Tip: Pull comps within a quarter-mile radius before you widen the search. A comp three blocks away in a different school zone will wreck your ARV math even if the square footage matches perfectly.
Run the conservative ARV through a flip profit calculator before you set your offer. If the math doesn’t clear at the conservative number, the deal doesn’t get better because you liked the optimistic one.
What Operational Risks Change Whether a Neighborhood Works?
A neighborhood with great comps and fast absorption still loses money if you can’t execute on schedule. Check these before you commit capital:
- Contractor lead times. Call three GCs who’ve worked that specific submarket in the last six months. If none can start inside four weeks, your holding cost clock is already running against you.
- Permit timelines. Local building departments vary wildly. Some jurisdictions turn a permit in five business days; others take six weeks for the same scope. Ask other investors, not the county website.
- Holding-cost sensitivity. Model interest, insurance, and utilities against your DOM assumption. A 30-day DOM assumption that slips to 90 days can turn a profitable deal into a break-even one, or worse.
- Capital match. Cash buys speed in fast-moving neighborhoods. Hard money carries interest that compounds against you in slower ones, so match your funding type to the exit speed the market actually delivers.
Execution risk, not headline appreciation, is what separates a flip that closes on schedule from one that bleeds carrying costs for six months.
What Should You See on a Drive-By That Confirms the Data?
- Maintenance level. Fresh paint, mowed lawns, and updated roofs on neighboring houses signal an owner-occupant market that will pay retail.
- Active renovations. Dumpsters, contractor trucks, and scaffolding on multiple houses confirm the permit data you already pulled.
- New retail or transit investment. A new grocery store, coffee shop, or transit stop nearby is a durable demand signal that outlasts a single market cycle.
- Negative proximity factors. Avoid blocks backing up to highways, airports, or industrial corridors. These depress exit price regardless of how good your rehab is.
- Investor saturation. Rows of identical vinyl siding and the same landscaping package mean other investors have already worked the block. That’s not disqualifying, but it tells you the comps you’re pulling are probably other flips, not organic owner-occupant sales.
A block-level read, owner-occupancy, visible upkeep, rehab density, often predicts your actual resale speed better than a city-wide average ever will.
Building a Weighted Scorecard for Neighborhood Selection
A scorecard turns a gut call into a repeatable number. Score each metric on a 1 to 5 scale, weight it by strategy, and total the result.
- Absorption (DOM). Weight heavily for cosmetic quick-turn flips, since speed is the entire return on a light rehab. Weight it moderately for deep rehabs, where your margin comes from forced appreciation instead of timing.
- Comp quality and depth. Weight this the same across both strategies. Thin comps make every other number unreliable.
- Owner-occupancy ratio. Weight higher for retail-exit strategies; weight lower if you’re planning a rental pivot as a backup exit.
- Rehab density / permit activity. Weight higher for deep rehabs in transitional neighborhoods, since it confirms capital is already moving there.
- Execution risk (contractors, permits). Weight this heavily regardless of strategy. A great score everywhere else doesn’t matter if you can’t staff the job.
A neighborhood scoring 4 or higher across most categories supports a full rehab scope against your expected ARV tier. A score of 2 or below on absorption or comp quality means you cap your rehab budget at cosmetic-only and underwrite to the conservative comp tier, not the expected one.
Pro Tip: Run your scorecard inputs through a hard money loan calculator before locking your MAO. A neighborhood that scores well on paper can still fail if financing costs outpace your absorption assumption.
How to Field-Test a Neighborhood Before You Wire Earnest Money
Data pulls tell you what happened. Calls tell you what’s happening now.
- Call two local agents. Ask how many showings a comparable listing got in its first week and whether buyers are waiving inspections.
- Call a lender active in that zip code. Ask about recent appraisal gaps between contract price and appraised value.
- Call two GCs. Ask for their next available start date, not their general availability.
- Pull active, pending, and sold comps for the trailing 90 days, plus permit history for the block.
- Walk the block. Photograph every house on both sides of the street and note visible deferred maintenance.
Assessing Neighborhood Economic Indicators
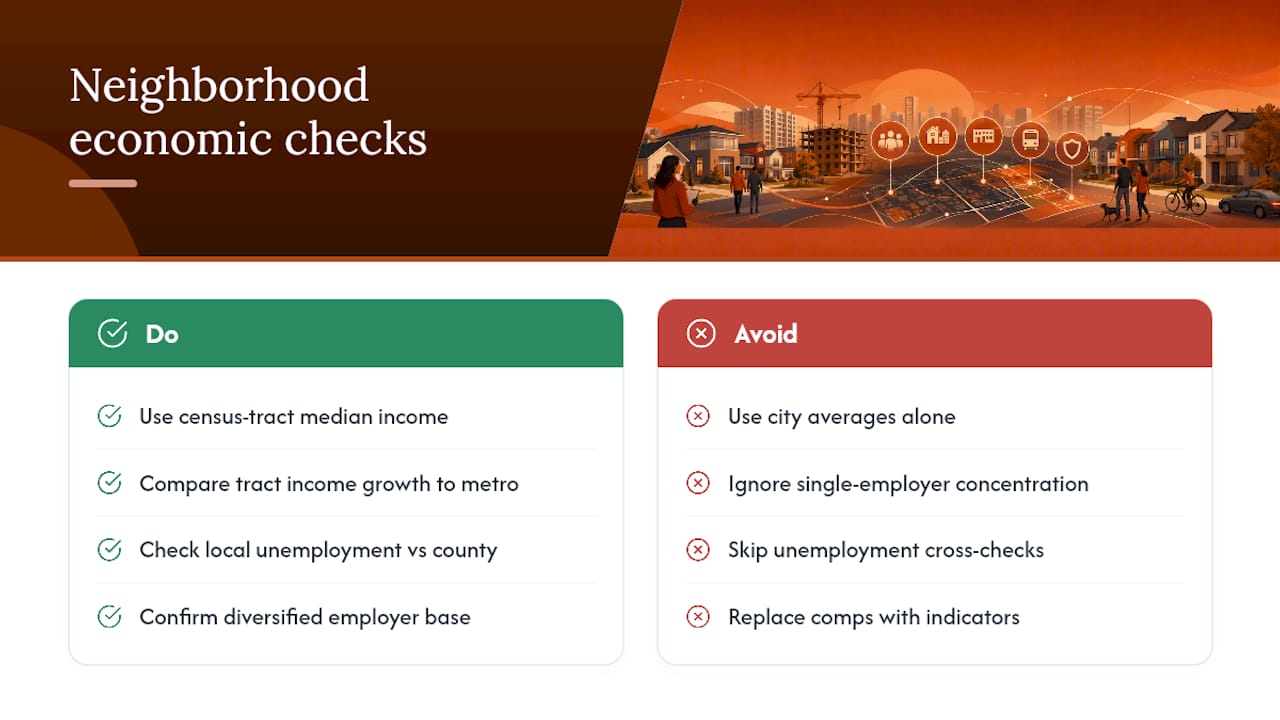
Employment concentration and income trends set the ceiling on what buyers can actually pay, not what you hope they’ll pay. A neighborhood near a single large employer carries concentration risk: a layoff announcement can freeze buyer demand for months, regardless of how good your rehab looks.
Pull median household income for the census tract, not the city average. City-wide numbers smooth over block-level differences that determine whether your finished product sells at your expected ARV or sits. If median income in the tract has grown over the last three to five years faster than the metro average, that’s a signal of increasing purchasing power, and it usually shows up in rising price per square foot before it shows up in headline appreciation numbers.
Diversified employment bases, multiple industries and employers rather than one dominant one, tend to produce steadier absorption. A neighborhood built around a single hospital system or manufacturing plant can swing hard on a single corporate decision. Cross-check local unemployment claims data against county averages; a tract running meaningfully above the county rate is a market where buyer financing gets harder, appraisals get more conservative, and your exit timeline stretches.
None of this replaces comps. It explains why comps move the direction they do, and whether that direction is likely to hold through your hold period.
Evaluating Local Zoning Laws and Future Development Plans
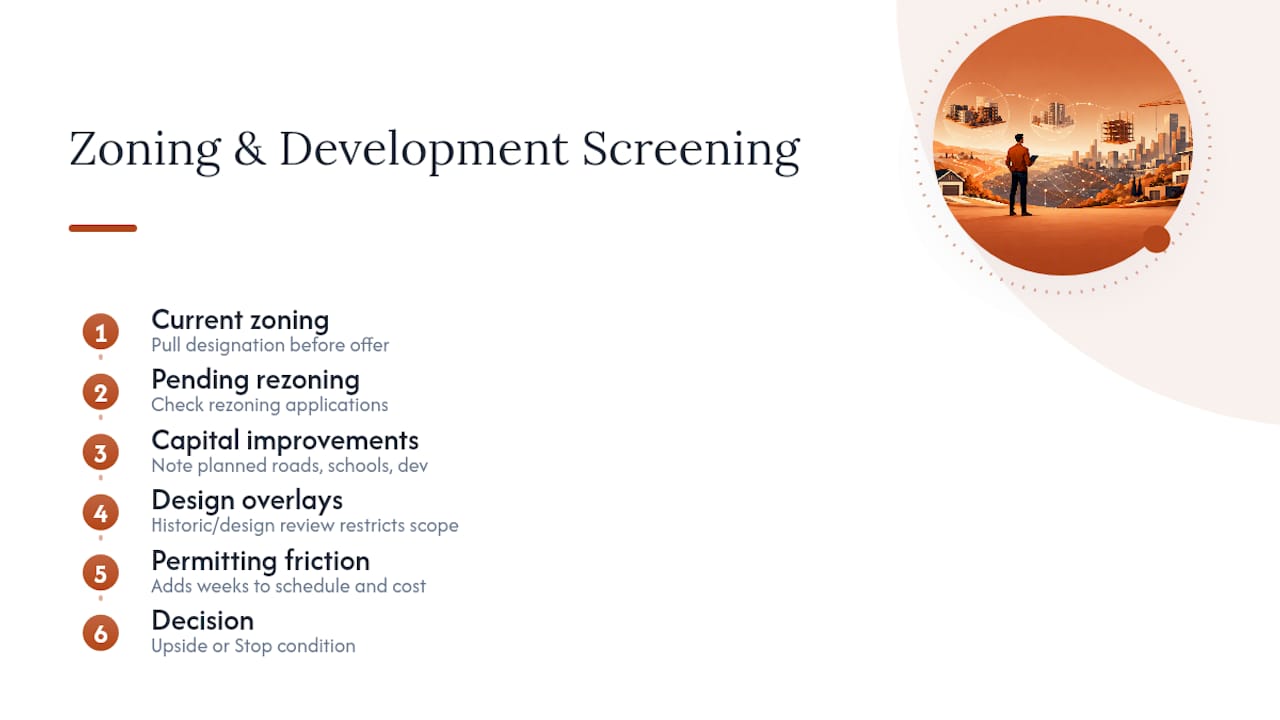
Zoning determines what can legally exist on a lot, and future zoning changes determine what will exist there in two years. Pull the current zoning designation before you write an offer, not after. A property zoned for higher density than its current use suggests upside if redevelopment pressure is building nearby, but it can also mean your single-family comp set is about to get diluted by new construction.
Check the city or county’s planning department for pending rezoning applications, capital improvement plans, and any adopted area plans covering the neighborhood. A planned road widening, a new school, or an approved mixed-use development nearby can lift absorption and price per square foot before the project even breaks ground. Conversely, a neighborhood slated for industrial rezoning or a planned highway expansion is a stop condition, not a discount opportunity.
Permitting friction ties directly to zoning too. Jurisdictions with strict historic-district overlays or design review boards add weeks to your rehab schedule and often restrict material choices, which changes your scope and budget before a hammer swings. Confirm this with the same call to the planning department where you’re checking rezoning activity. Zoning risk is invisible in comp data and shows up only when you ask the right office the right question.
Understanding Demographic Trends and Buyer Profiles
The buyer profile in a neighborhood determines what finishes and layout sell, and demographic shifts change that profile faster than most flippers track. A neighborhood filling with young families wants finished basements, fenced yards, and proximity to elementary schools. A neighborhood trending toward single professionals and empty nesters wants low-maintenance finishes and walkable amenities over square footage.
Pull age distribution and household composition data for the census tract and compare it to the trailing five years. A tract where the median age is dropping and household size is shrinking is trending toward smaller households with different renovation priorities than a stable family neighborhood. This changes your scope decisions directly: a rehab that adds a fourth bedroom in a neighborhood trending toward smaller households may not recoup that cost at resale.
Match your comp set to the actual buyer profile, not just the physical structure. Two houses with identical square footage in neighborhoods with different demographic trajectories will not sell to the same buyer, and won’t command the same price per square foot. Read demographic shift alongside owner-occupancy ratio: rising owner-occupancy paired with a younger family demographic is one of the stronger combined signals for a durable retail exit.
Analyzing Neighborhood Infrastructure and Transportation Access
Transit access and road infrastructure affect both your buyer pool and your holding costs. A neighborhood within walking distance of a transit stop or a short commute to a major job center draws a wider buyer pool than one that requires a car for every errand, and that wider pool usually means faster absorption.
Check planned infrastructure investment the same way you check zoning: through the city or county capital improvement plan. A new transit line, an interchange upgrade, or a bridge repair scheduled during your hold period can either help or hurt you depending on timing. A road closure for construction during your listing period can add weeks to your DOM regardless of how well-priced the house is.
Road condition and traffic pattern matter at the block level too. A house on a cut-through street with heavy commuter traffic sells for less than an identical house on a quiet cul-de-sac two blocks over, even within the same neighborhood boundary. Note traffic counts during your drive-by, ideally at both morning and evening commute times, and weigh that against the comp you’re using. Infrastructure access is a durable demand driver; construction disruption during your hold period is a temporary but real DOM risk.
Identifying Legal and Environmental Issues Before You Close
Title issues and environmental liabilities can turn a good neighborhood screen into a bad deal. Pull a preliminary title report before you go under contract, not after. Open liens, easement disputes, or unresolved code violations attached to a specific property don’t show up in neighborhood-level data, and they can stall your closing or your resale.
At the neighborhood level, check for known environmental hazards: proximity to a former industrial site, a documented flood zone, or a neighborhood with a history of soil contamination from prior land use. Flood zone designation alone can affect insurance costs enough to change your holding-cost math, and it will affect your buyer’s financing too. Pull FEMA flood maps for any neighborhood near a waterway before you underwrite.
Local code enforcement patterns matter as an execution risk. A jurisdiction with aggressive code enforcement and a backlog of open violations on nearby properties signals slower permit turnaround and more inspection friction on your own project. Ask the GCs you’re already calling about lead times whether they’ve dealt with code enforcement delays on that specific street. Legal and environmental risk rarely shows up in a comp report, but it shows up fast in a stalled draw schedule.
Where FLIP Fits Into Your Neighborhood Screen
Every metric in this guide, absorption rate, comp tiers, holding-cost sensitivity, rehab density, only matters if you can run the math fast and consistently across every neighborhood you’re evaluating. Most flippers lose that consistency somewhere between the fifth deal and the fiftieth, when spreadsheets get out of sync and gut calls creep back in.
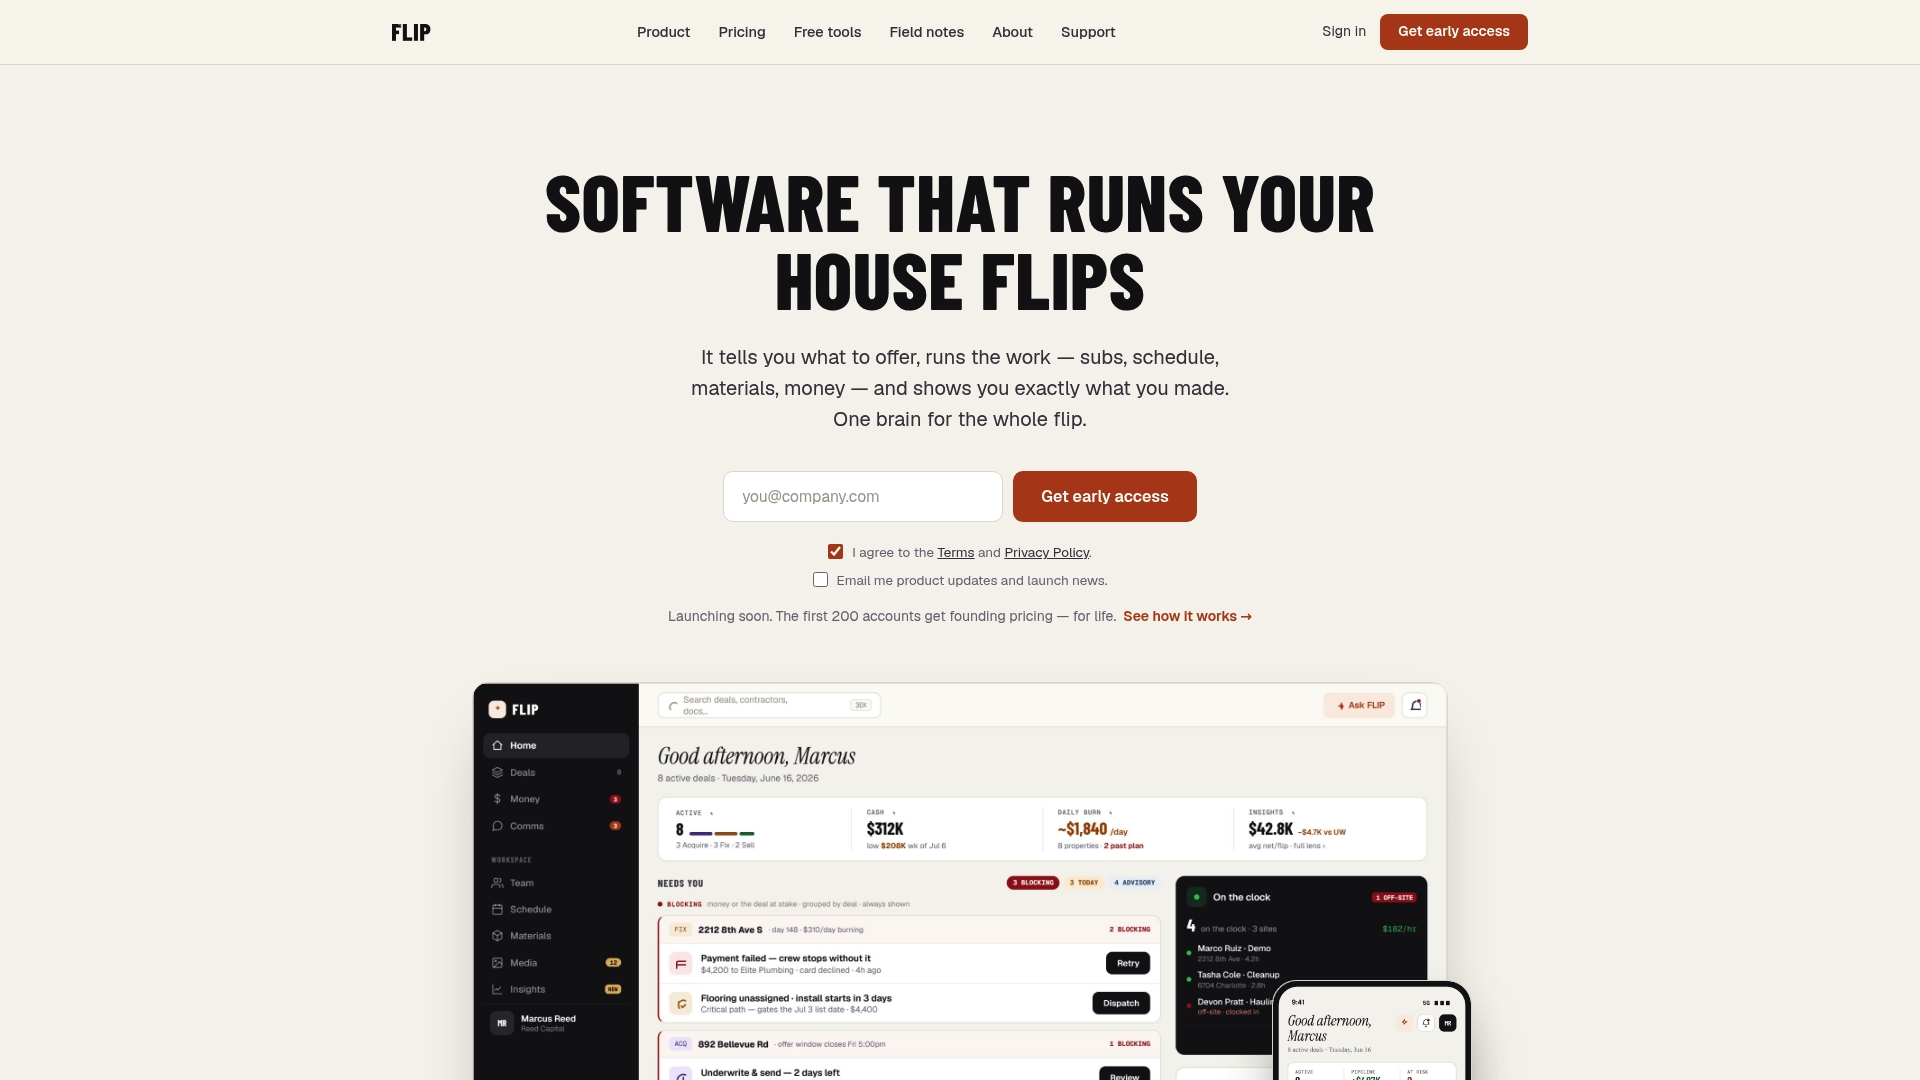
FLIP’s free calculators map directly to the screen in this guide. Run your conservative and expected comp tiers through the ARV, profit, and holding cost calculators to see whether a neighborhood’s absorption rate actually supports your target rehab budget before you write an offer. Test DOM sensitivity through the flip profit calculator to see exactly where a slow-absorption neighborhood turns your margin negative. If financing type is part of your neighborhood match, the hard money loan calculator shows the real cost of capital against a specific DOM assumption instead of a rough guess.
Beyond the calculators, software may support the operations layer that picks up once you’ve underwritten the deal: scopes of work, draw schedules, subcontractor bids, and lien waivers, so the same rigor you apply to picking a neighborhood carries through to running the job. FLIP is in early access now. Get on the list at Flip to see it when it opens up.
Primary Sources and Data References
- ATTOM’s Neighborhood Housing Index breaks down flipping returns against neighborhood grade, useful for reading ROI signals against affordability and owner-occupancy.
- BiggerPockets’ guidance on buying fix-and-flip property covers proximity factors and condition checks that feed the qualitative drive-by screen.
- Industry underwriting guidance on comp tiers and price ceilings supports the conservative-ARV framework used throughout the scorecard section.
- The Home Comparison Chart from Nest Noted offers a practical format for building your own neighborhood comparison matrix.
- Blue Key Home Buyers’ ARV breakdown explains the core calculation behind the comp-to-ARV method used in this guide.
FAQ
What Is the 70% Rule in Flipping?
It’s a rough screening tool, not a substitute for building conservative comp tiers and testing DOM sensitivity against your actual holding costs.
What Is the 3-3-3 Rule in Real Estate?
Definitions vary by market and lender, but one common version ties to loan qualification timelines rather than flipping itself. For flip underwriting, the more reliable framework is the comp-tier and absorption-rate screen covered above.
What Is the Hardest Month to Sell a Home?
Late fall and winter months, particularly November through January in most U.S. markets, typically show slower absorption and longer DOM than spring and summer listings. Factor seasonal DOM shifts into your holding-cost sensitivity test before you set a listing date.
Where Is the Best Area to Flip Houses?
There’s no single best area. The right neighborhood is the one where DOM runs 30 to 60 days, comps are thick and recent, owner-occupancy is strong, and contractor and permit turnaround match your rehab timeline. Run the scorecard in this guide against your local submarkets rather than chasing a national ranking.
Recommended
FLIP runs the whole job — scope, subs, schedule and money on one record.