Top 10 Cities to Flip Houses in 2026: ROI, Fast Exits, FLIP Execution
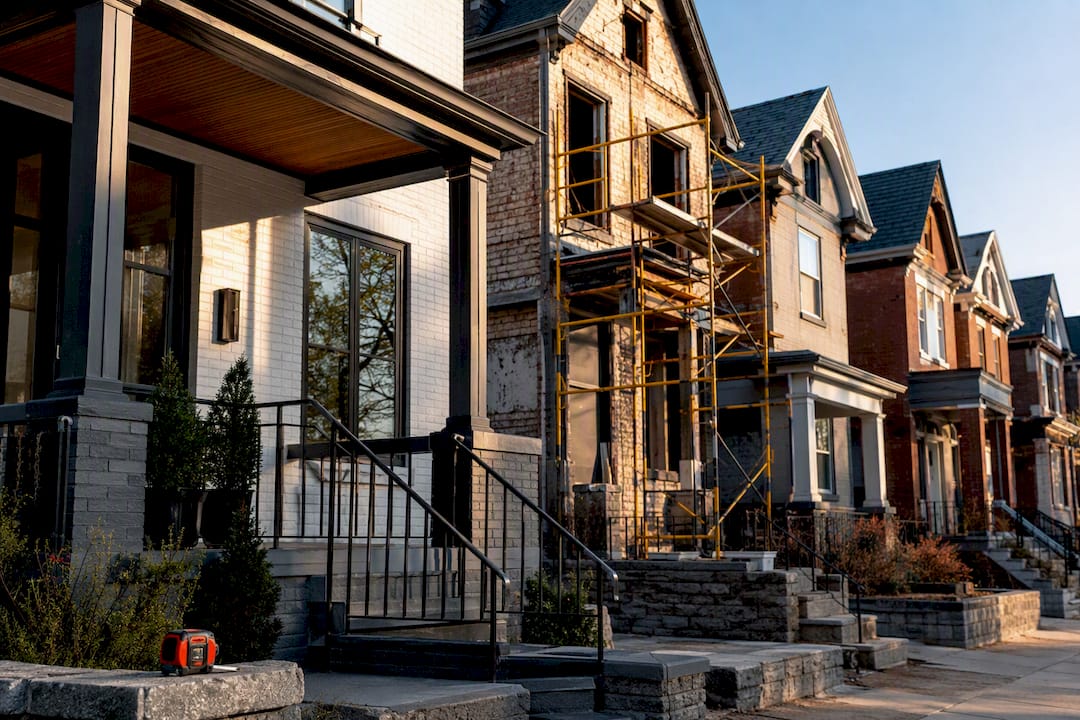
Pittsburgh, Buffalo, Hartford, Rochester, and Toledo lead the best cities to flip houses in 2026. Each pairs a low entry price with a gross flip ROI above the national average, and buyer demand strong enough to move renovated inventory before holding costs eat the spread. The full ranking, the metrics behind it, and how to size a market to your capital follow below.
TL;DR:
- Markets like Pittsburgh and Toledo offer the highest gross flip ROI, but smaller metros like Peoria and Flint require very precise scope and tight underwriting.
- High-margin cities such as Pittsburgh provide larger profit margins per deal, while low-entry markets like Toledo and Flint enable more rapid deal turnover with limited capital.
- Fast turnover is critical in markets like Rochester andGrand Rapids, where median days on market are around 8 to 7 days, reducing holding costs significantly.
- Markets such as San Jose, Austin, and Miami carry high entry costs and volatile demand, making them riskier for small-scale or less-capitalized flippers in 2026.
- Proper due diligence, including verifying zoning, permits, and local laws, is essential to avoid delays and hidden costs that can erode margins in any chosen market.
Table of Contents
- Best Cities to Flip Houses: The Top 10 Ranked by ROI
- How This Ranking Was Built
- How to Choose the Right City for Your Flip Business Model
- Markets to Approach With Caution in 2026
- Where the Opportunities Cluster Regionally
- Underwriting and Execution Once You Pick a Market
- Local Zoning, Permits, and Landlord-Tenant Rules
- Tax Considerations Across These Markets
- Common Risks by City and How to Mitigate Them
- FLIP: Operations Software for the Markets on This List
- Sources Behind This Ranking
- FAQ
Best Cities to Flip Houses: The Top 10 Ranked by ROI
Gross flip ROI compares total investment (purchase plus rehab) against resale price. It is the single number that matters most, but it means nothing without entry price and exit speed next to it. Here is the ranked list, in order.
1. Pittsburgh, PA — best for the widest margin. Typical purchase price sits around $110,000 with resale near $204,500, a gross profit of roughly $94,500 and a margin near 85.9% in Q1 2026 reporting, the strongest of any major U.S. metro. Older housing stock and low competition from institutional buyers keep entry costs down.
2. Buffalo, NY — best for cold-market discipline. Buffalo shows up on multiple 2026 lists of promising flip metros because inventory has stayed below pre-pandemic levels, which keeps resale pricing power intact for renovated homes. Entry price stays low relative to coastal metros, and the buyer pool is local, not speculative.
3. Hartford, CT — best for Northeast flippers avoiding Boston or New York prices. Hartford appears in both LendingOne’s and Stacker’s 2026 top-tier lists. The city combines an aging housing stock that needs work with a resale market that still absorbs updated inventory at a reasonable clip.
4. Rochester, NY — best for fast turnover. Regional resale rollups put Rochester’s median days on market around 8 days for updated listings, one of the tightest exit windows on this list. Fast exit lowers holding-cost exposure, which matters more than a wide margin if your capital is expensive.
5. Toledo, OH — best for low-capital entry. Toledo’s price floor is low enough that a flipper working with limited capital or a first hard-money loan can get into a deal without stretching the loan-to-cost ratio thin.
6. Grand Rapids, MI — best for speed plus spread. Grand Rapids posts a median days-on-market near 7 days in recent rollups, and it still carries a workable gross flip ROI. Few metros combine fast exit with real margin the way Grand Rapids does right now.
7. Milwaukee, WI — best for Midwest scale. Milwaukee gives flippers a larger buyer pool than the smaller Rust Belt metros on this list, without pushing entry price into Sunbelt territory. It suits operators who want to run multiple flips at once.
8. Peoria, IL — best for contrarian value. Peoria surfaces in LendingOne’s 2026 top-10 fix-and-flip markets. It is a smaller market, which means fewer competing flippers bidding up acquisition price, but it demands tighter local comps work since sale volume is thinner.
9. Flint, MI — best for the lowest possible entry price. Flint carries the lowest purchase-price floor on this list. That is also the risk: thin buyer pools mean a flip has to be scoped precisely to the local ARV, not to a renovation budget built for a different market.
10. Fort Smith, AR — best for a Sunbelt-adjacent alternative without Sunbelt pricing. Fort Smith gives flippers exposure to a growing Southern market without the entry costs that have compressed margins in Austin or Phoenix.
How This Ranking Was Built
The ranking weighs five metrics: gross flip ROI, median purchase price, inventory relative to pre-pandemic baselines, days on market, and year-over-year price appreciation. Gross flip ROI and purchase price set the ceiling on profit. Inventory and days on market set how fast that profit converts to cash.
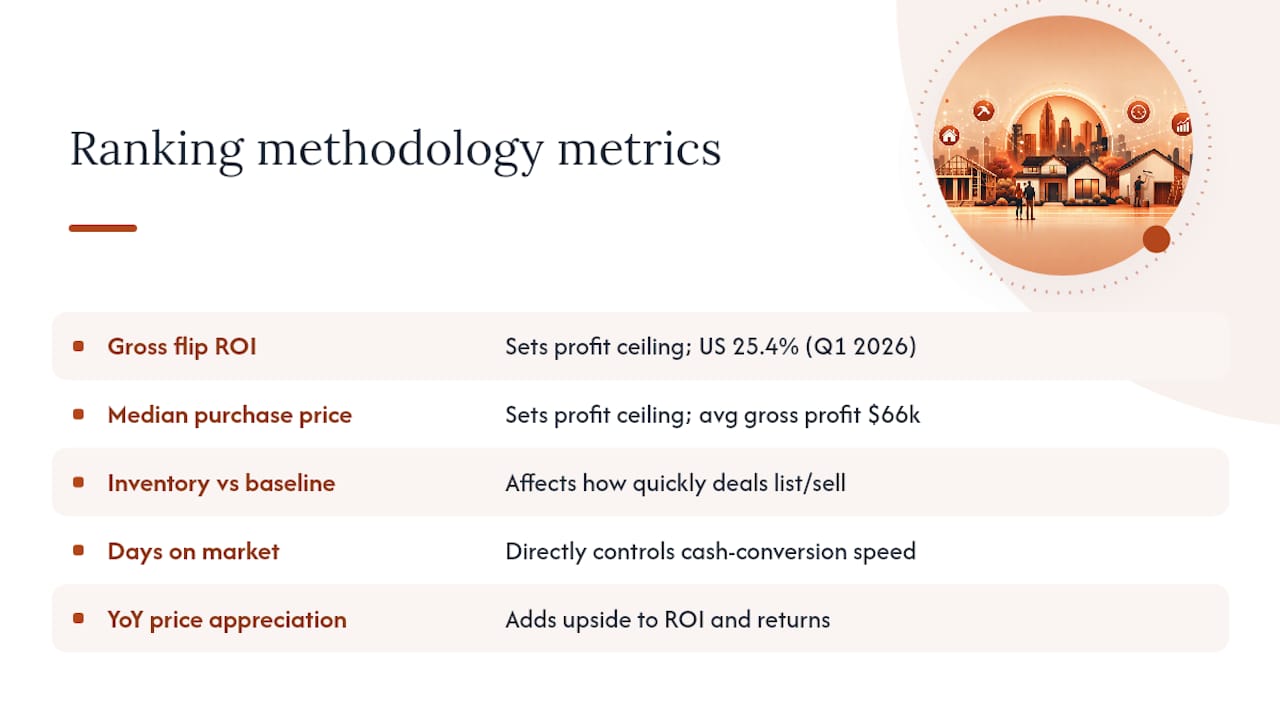
Primary data comes from ATTOM’s flip reporting, Zillow’s regional rollups, LendingOne’s market notes, WalletHub’s 172-city comparison across market potential, renovation cost, and quality of life, and Stacker’s list of promising and risky flip metros for 2026. ATTOM’s Q1 2026 data put the national gross flip ROI at 25.4%, with average gross profit around $66,000. Every city on this list beats that national baseline on at least one metric.
Data snapshot: National gross flip ROI: 25.4% (Q1 2026). Pittsburgh’s gross margin: 85.9%, more than triple the national figure.
Two limits apply. First, metro-level averages hide submarket variation. A 15-mile radius can swing a ZIP code’s ARV by six figures. Second, sample sizes shrink in smaller metros like Peoria and Fort Smith, which widens the margin of error on reported ROI. Run local comps before you commit capital to any number on this list.
How to Choose the Right City for Your Flip Business Model
The ranking tells you where the spread is. It doesn’t tell you whether that spread fits your business. Match the market to your model using four axes.
- Capital available. Low-entry markets like Flint and Toledo let you run more deals per dollar of capital. High-margin markets like Pittsburgh require more cash per deal but return more per deal.
- Rehab complexity you can manage. Older housing stock in Rust Belt metros often means structural or mechanical work, not just paint and flooring. Match your contractor bench to the age of the housing stock before you buy.
- Contractor ecosystem depth. A market with three general contractors bidding your scope will beat a market with one, even if the second market’s ROI number looks better on paper.
- Exit strategy and timeline. If your capital is expensive (hard money at 12% plus points), prioritize Rochester or Grand Rapids over a wider-margin, slower-moving market.
Run this due-diligence checklist before you close: pull three closed comps within 90 days and a half mile, confirm permit turnaround time with the local building department, get two contractor bids on the full scope, confirm hard-money lender availability in that county, and stress-test your rehab budget against ARV, not against what you’d like to spend.
Red flag: days on market stretching past 60 in your target ZIP code. Mitigation: lower your maximum allowable offer to build in a bigger cushion, or walk.
A thin comp set hides a market that’s turning against you.*
Markets to Approach With Caution in 2026
Several major metros carry the opposite profile: high entry cost, compressed spread, and volatile demand. Stacker’s 2026 analysis flags San Jose, Austin, Miami, Phoenix, San Francisco, and Las Vegas as markets where flipping currently carries elevated risk.
- San Jose and San Francisco: entry price is so high that even a well-scoped rehab struggles to produce a workable margin after holding costs.
- Austin and Phoenix: rapid price appreciation in prior years pulled forward much of the upside, and renovation costs haven’t come down to match.
- Miami and Las Vegas: demand is volatile and tied to migration and tourism cycles, which makes exit timing harder to underwrite.
Well-capitalized operators with existing crews and volume-based sourcing can still find deals in these metros. A flipper doing one or two deals a year should look elsewhere.
Where the Opportunities Cluster Regionally
Rust Belt, Midwest, and Northeast metros dominate this year’s list because their housing stock is old enough to need real work, and their inventory has stayed tighter than pre-pandemic levels, which protects resale pricing on updated homes. That combination is rare. Coastal metros and several Sunbelt hubs show the opposite pattern: high entry cost compresses the spread even when appreciation looks strong on paper.
The operational trade-off matters more than the map. High-volume Sunbelt markets, where flip rates can run well above the national average, demand aggressive, fast sourcing to win deals before competitors do. Lower-volume Midwest and Northeast markets demand the opposite: precise underwriting, deep local comps knowledge, and a contractor relationship that doesn’t fall apart on your third project. Pick your operating style before you pick your city.
Underwriting and Execution Once You Pick a Market
Picking the city is the easy part. Execution decides whether the spread survives contact with a rehab.
- Pull comps within a half mile and 90 days, or you’re underwriting off stale data.
- Set MAO using: (ARV x 0.70) minus repair costs, then adjust the 0.70 down in thinner markets like Peoria or Fort Smith where the margin for comp error is smaller.
- Scope the rehab to the ARV of your target buyer, not to your own taste in finishes.
- Run a draw schedule tied to inspected milestones, not calendar dates.
- Collect W-9s and lien waivers from every sub before the first draw goes out.
- Require photo-verified proof of completed work before approving payment.
Pro Tip: A lien waiver collected after the final draw is worthless. Collect it before you release payment on that draw, every time, no exceptions.
Execution controls like these are what protect margin once the city is chosen. FLIP’s rehab scope checklist and hard money calculator exist for this exact stage of the deal.
Local Zoning, Permits, and Landlord-Tenant Rules
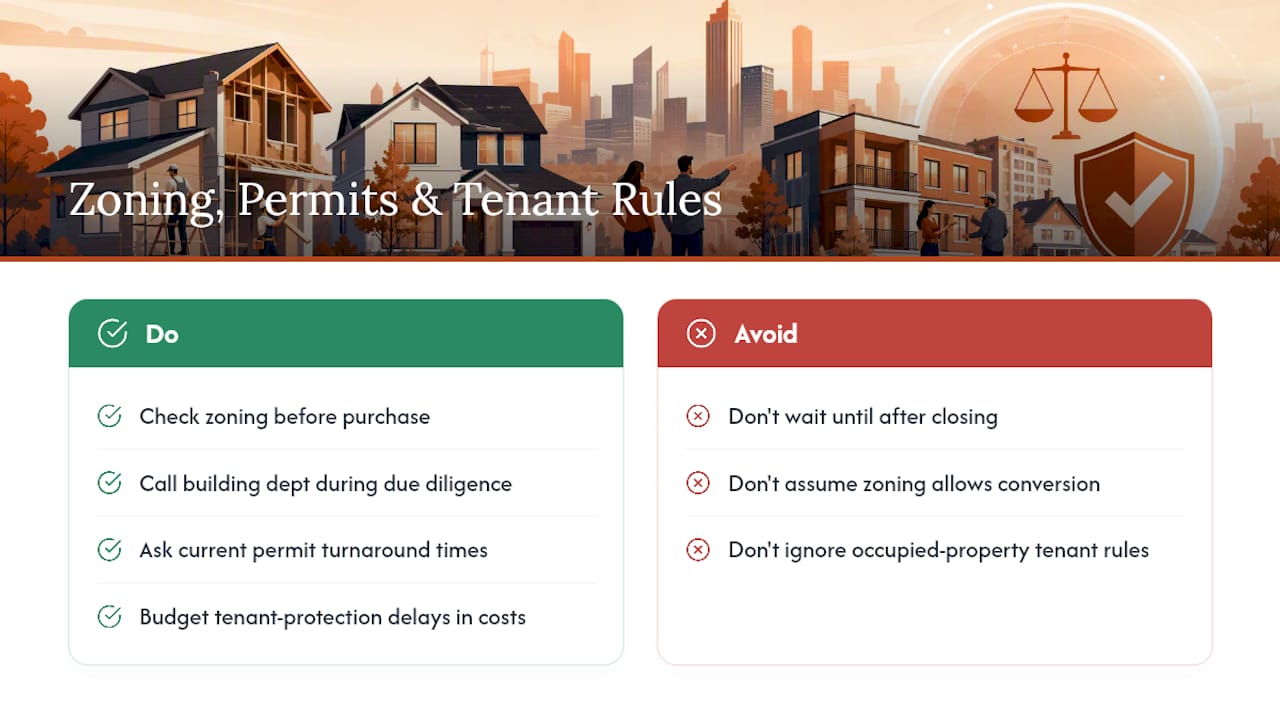
Zoning and permit rules vary by city and county, and they change your renovation timeline before they change anything else. Cities like Pittsburgh and Buffalo have older housing stock, which often means older zoning codes with more variances and conditional-use quirks than newer Sunbelt suburbs. Check zoning before you buy, not after: a lot zoned for single-family only kills a conversion plan you may have priced into your ARV.
Permit turnaround time is the hidden cost most flippers underprice. A city with a six-week permit backlog adds six weeks of holding cost before a single stud gets replaced. Call the local building department during due diligence, not after closing, and ask specifically about current turnaround for the permit types your scope requires: electrical, plumbing, structural.
Landlord-tenant law matters if you’re buying occupied property. Some cities require formal notice periods and relocation assistance before a tenant-occupied home can be vacated for rehab, and local rules override general assumptions. Flint and Toledo, both lower-cost entry markets, have local tenant protections that can extend your acquisition-to-vacant timeline by weeks. Budget for that delay in your holding-cost math, not as an afterthought.
Tax Considerations Across These Markets
Flip profit is generally taxed as ordinary income, not long-term capital gains, because flipped properties are held as inventory rather than investment property in most cases. That distinction holds regardless of which city on this list you’re operating in. A property held under a year, which describes most flips, doesn’t qualify for the favorable long-term capital gains rate even if you wanted it to.
A 1031 exchange, which defers capital gains tax by rolling proceeds into a like-kind property, generally does not apply to flip inventory. The IRS treats flipped homes as inventory for a dealer, not as investment property held for appreciation, and 1031 exchanges are built for the latter. Some investors structure entities specifically to preserve 1031 eligibility on a separate buy-and-hold portfolio while running flips through a different entity. That structure is a conversation for a CPA, not a blog post.
Standard business deductions still apply: rehab materials, contractor labor, holding costs like interest and insurance, and platform or software costs used to run the deal. Some flippers financing rehab work also look at HUD’s 203(k) rehab loan program for owner-occupant purchases, though it doesn’t apply to most pure investment flips. Track every deductible cost by property, not in one combined ledger, because a tax preparer working across ten flips in five cities needs project-level detail to file correctly.
Common Risks by City and How to Mitigate Them
Every city on this list carries a distinct failure mode, not a generic one. Pittsburgh and Buffalo’s older housing stock hides structural and mechanical surprises that a surface inspection misses.
Rochester and Grand Rapids reward speed, but a rushed scope on a fast-moving market produces callback issues that erase the time advantage. Mitigation: lock your scope of work before demo starts, and don’t let a sub add work orders mid-project without a signed change order.
Flint and Peoria’s thin buyer pools mean one overpriced flip sitting unsold can distort your read on the whole market. Mitigation: price to the tightest, most recent comp set you have, not to your target margin.
Across every market, the most common pitfall is the same: underwriting the deal once at acquisition and never revisiting it as costs move.
FLIP: Operations Software for the Markets on This List
Picking Pittsburgh over Phoenix solves half the problem. The other half is running the deal without losing margin to change orders, missed draws, and paperwork that falls through the cracks between you, your general contractor, and six subs. That’s the operations layer, and it’s where most flips actually lose money.
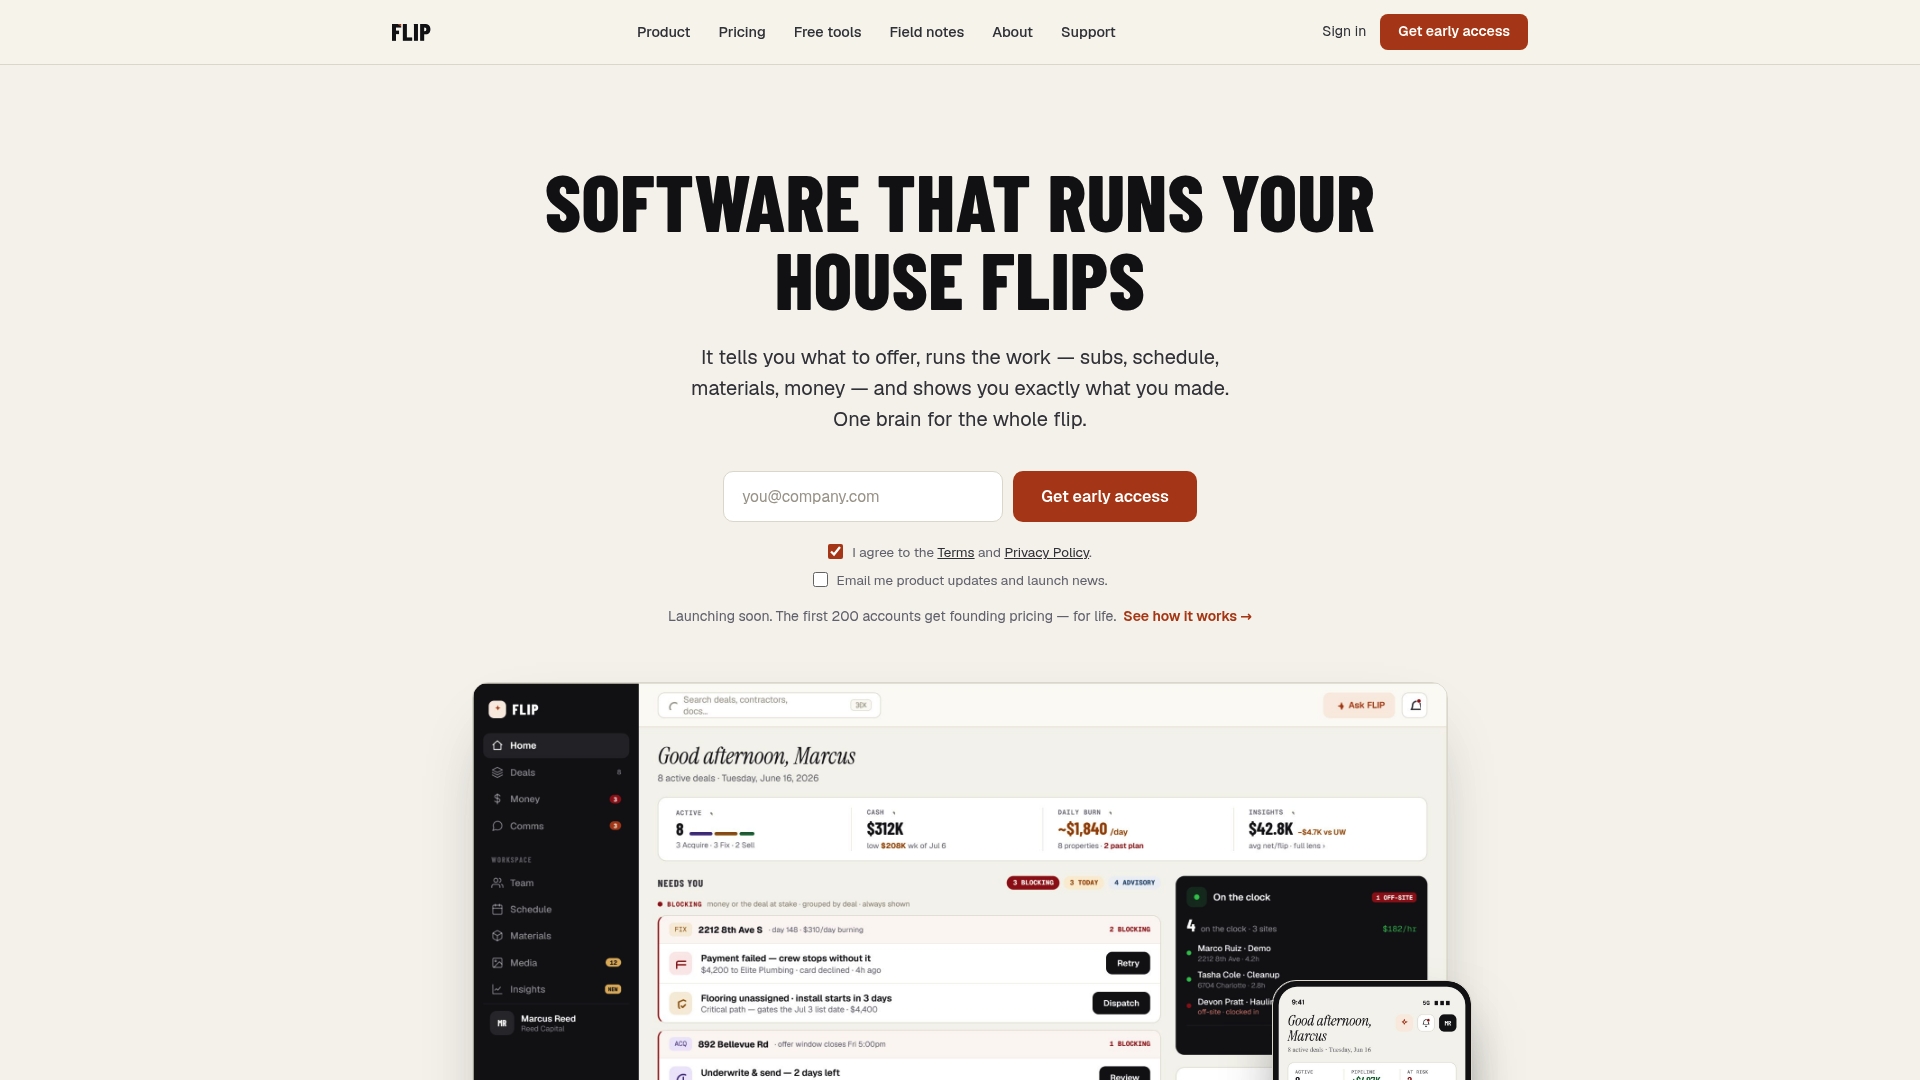
FLIP is built for the flipper running deals in exactly these markets, not for the contractor doing the work. It replaces the spreadsheet-plus-text-thread setup most operators cobble together with one system: comping and repair budgeting, scope of work, a rehab schedule with real task dependencies, work orders and sub bidding, contractor paperwork including W-9s and lien waivers, photo-verified payment approval, and profit tracked against your original underwriting as the deal moves. Subs log in through their own phone-number access and use it free.
FLIP is in early access. Run your next deal’s numbers now with the flip profit calculator, or see plans and pricing for current details. If you’re evaluating a purchase in one of the markets above and want the marketing and resale side handled too, 121 Groups real estate marketing team works with property developers on listing strategy once the rehab is done.
Sources Behind This Ranking
This ranking draws on ATTOM’s Q1 2026 flip-return data, Zillow’s regional resale rollups, LendingOne’s 2026 fix-and-flip market report, WalletHub’s 172-city flip comparison, and Stacker’s list of promising and risky 2026 flip metros. Each source covers a different metric: ROI, resale speed, or market risk.
This article is general information, not a substitute for advice from a qualified financial advisor. Consult a qualified financial professional about your own circumstances before acting on anything here.
FAQ
What Is the 70% Rule in House Flipping?
It builds in margin for holding costs, closing costs, and profit, and flippers in thinner markets like Peoria or Fort Smith often push that percentage lower to account for wider comp uncertainty.
Which State Is Best for Flipping Houses in 2026?
No single state dominates, but Pennsylvania, New York, and Ohio all place multiple cities on the 2026 list of top flip markets, including Pittsburgh, Buffalo, Rochester, and Toledo. Older housing stock and tighter-than-pre-pandemic inventory drive that regional strength.
Is Flipping Houses Still Profitable in 2026?
Yes. Profitability now depends heavily on market selection and tight execution, not just timing the broader market.
What Is the 3-3-3 Rule in Real Estate?
Definitions vary, but a common version applies it to house hacking or rental strategy rather than flipping directly: save for 3 years, buy a property you can afford on 3 times your income, and hold for at least 3 years.
How Do I Track Profit Across Multiple Flip Markets?
Track cost and revenue at the individual property level, not in one combined ledger, especially when running deals across different cities with different tax and permit timelines. Software like FLIP is built to track profit against your original underwriting as each deal moves through rehab and sale.
Recommended
FLIP runs the whole job — scope, subs, schedule and money on one record.